

BI

Keep Your BI Projects Organized
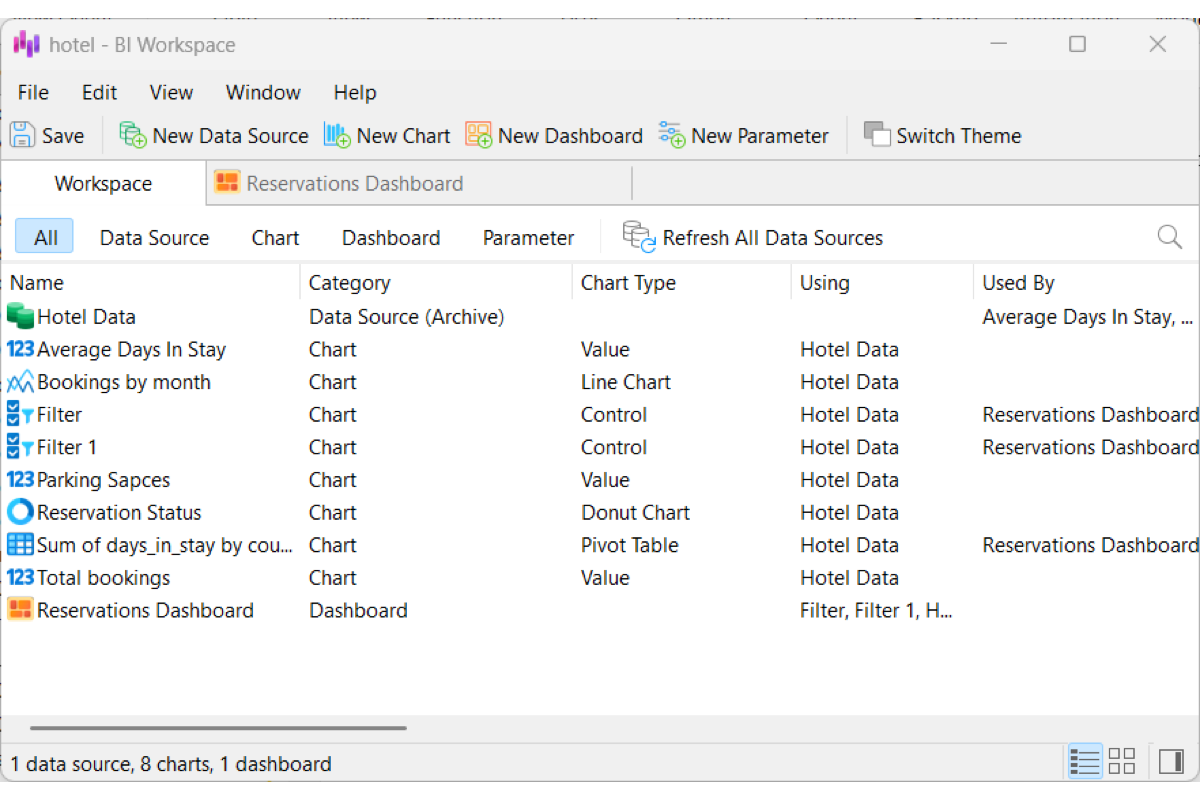
See the big picture of your analytics project in a single unified workspace. Displaying data sources, charts, dashboards, and parameters together gives you full clarity over your report setup, while dedicated property tabs let you track asset dependencies to see exactly which data sources feed each visual.
Prepare & Connect Your Data
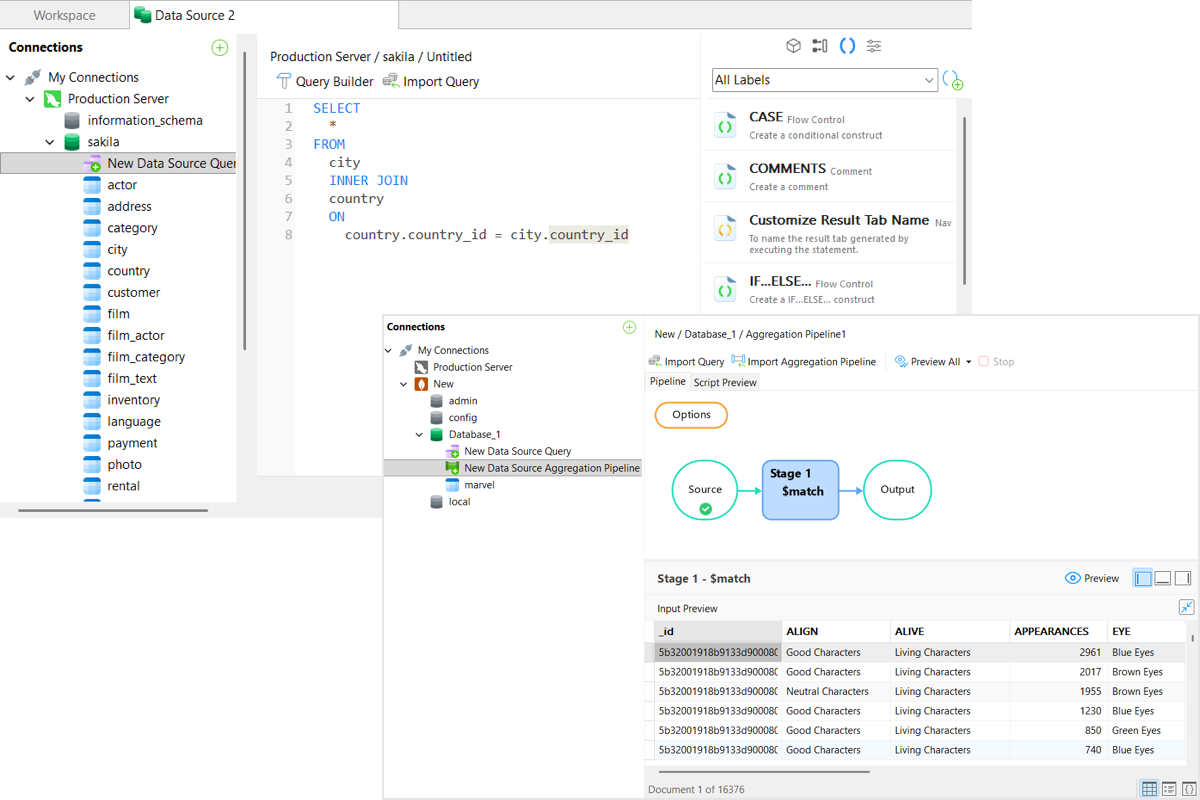
Build clean, unified datasets by connecting directly to relational databases, cloud platforms, MongoDB, external data files, or ODBC sources.
Custom Queries & Visual Pipelines
Write custom SQL queries or build MongoDB pipelines stage-by-stage, or import saved ones as canvas nodes.
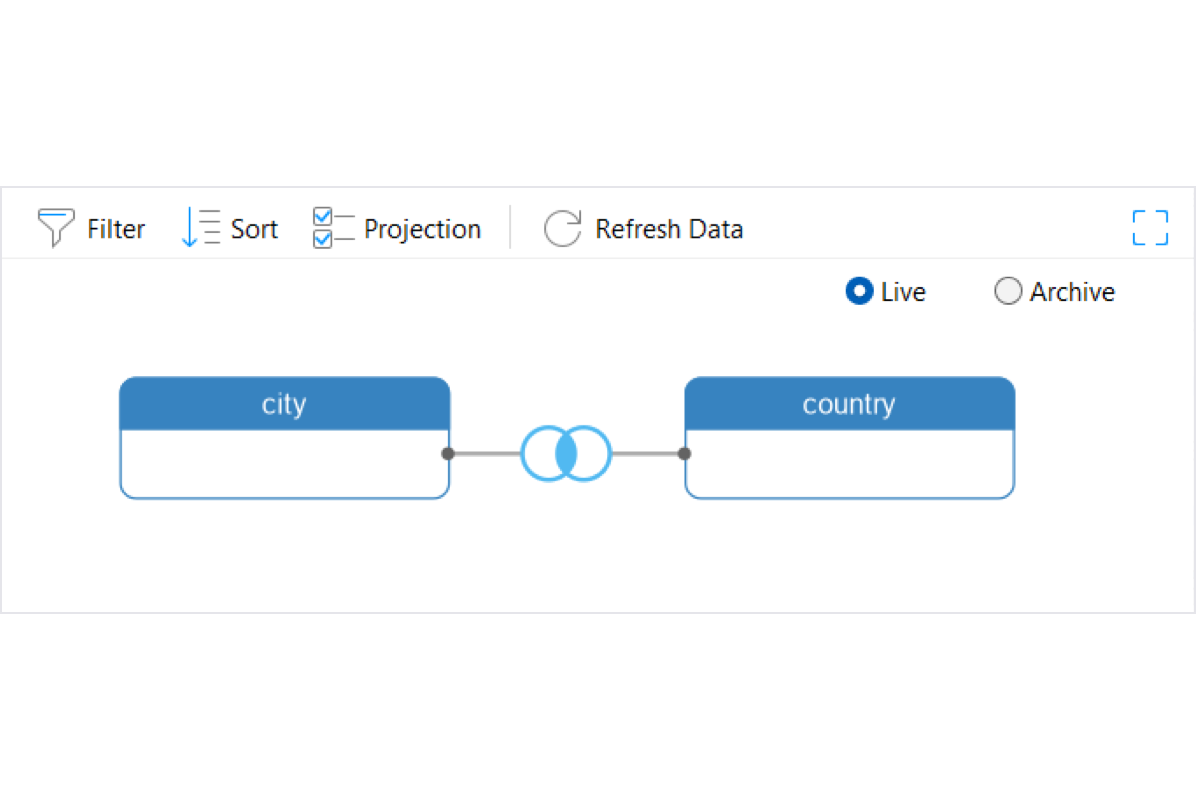
Cross-Database Visual Joins
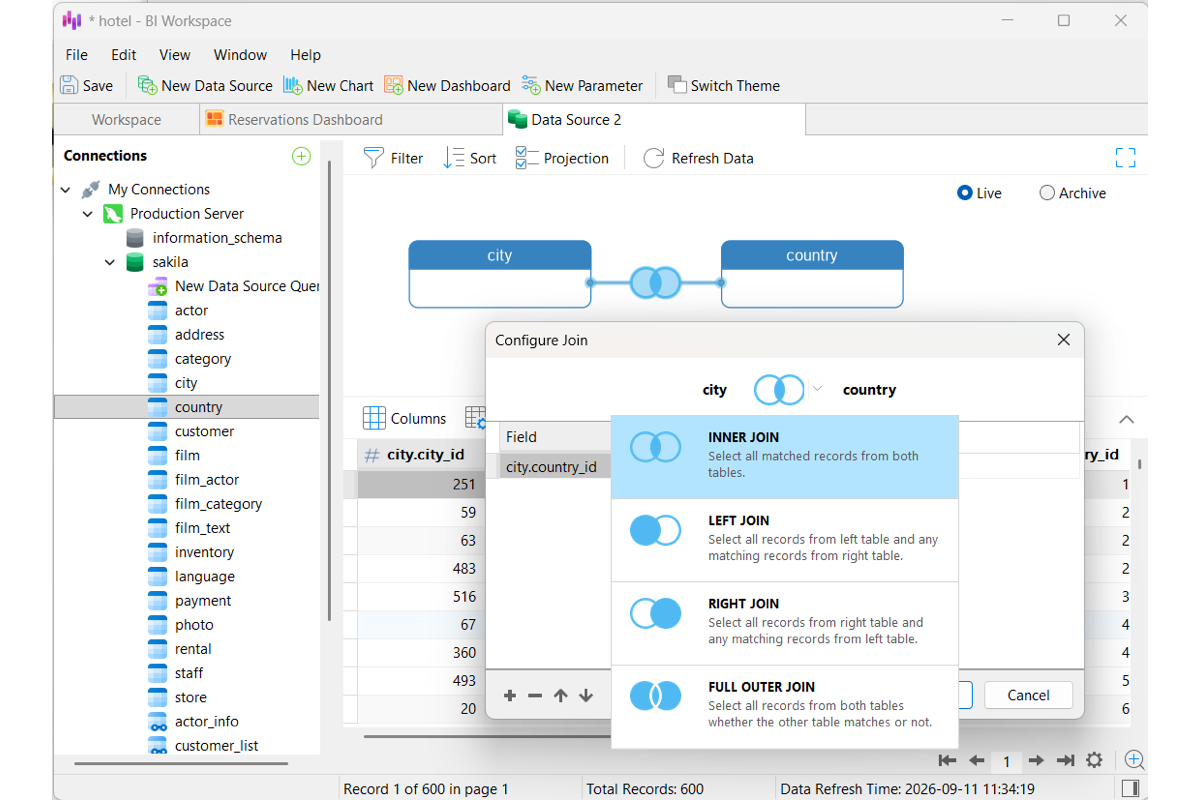
Link tables, queries, and pipelines across different data sources using configurable join types and matching fields.
Live & Archive Modes
Toggle between Live mode for real-time database updates and Archive mode for fast offline reporting.
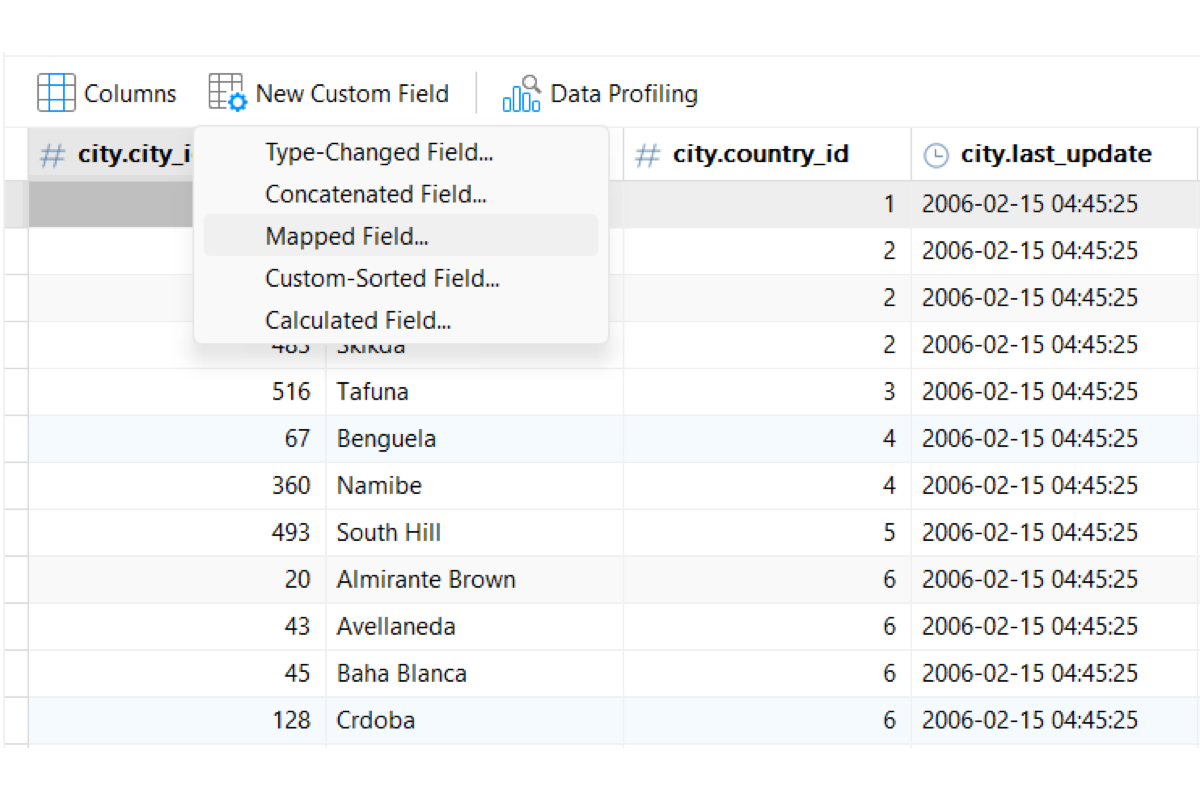
Field Selection & Custom Fields
Include or exclude specific fields, and build new attributes via custom expressions, type conversions, value mapping, or custom sorting.
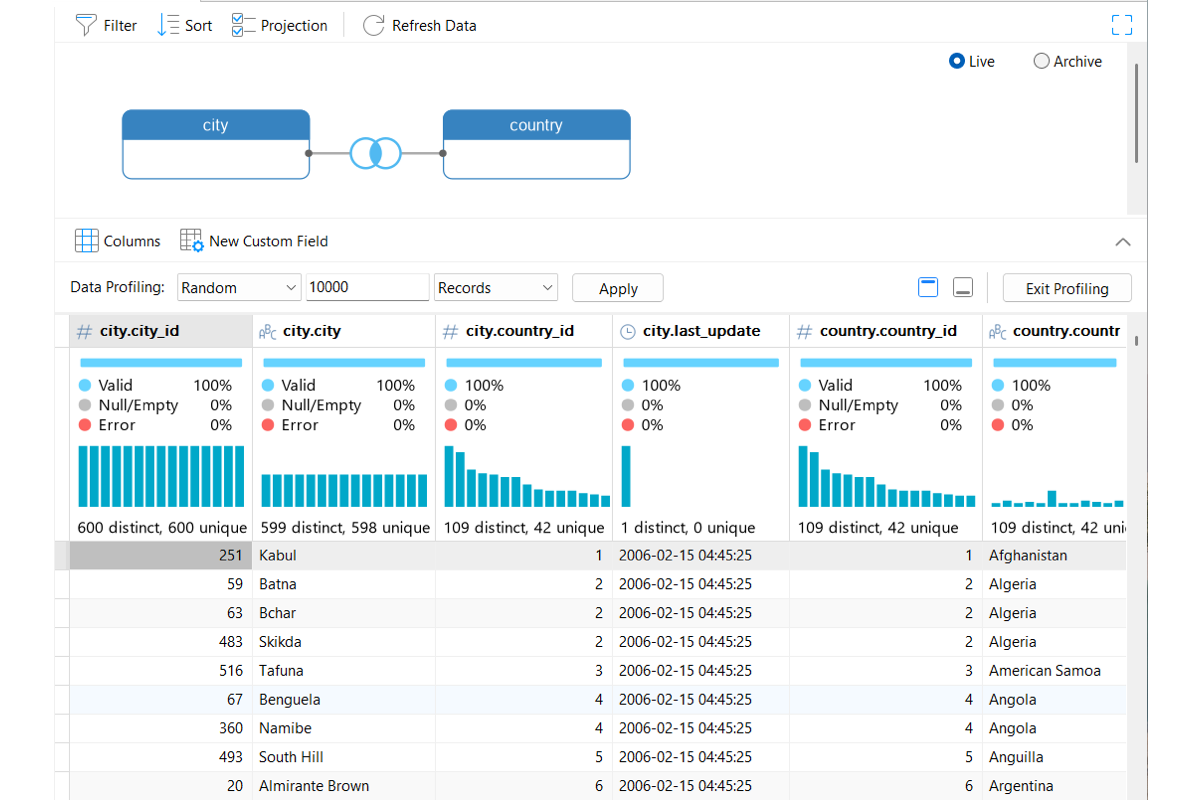
Data Profiling
Inspect column metrics to evaluate data integrity, uncover hidden trends, and spot errors before building charts. Learn more
Design Interactive Charts
Transform your datasets into visual insights with over 20 chart types, including KPI cards, scatter plots, heatmaps, gauges, and treemaps, mapped directly to your data source.
Drag-and-Drop Builder
Map fields to axis, group, or value shelves to build charts instantly with custom aliases, labels, colors, and formatting.
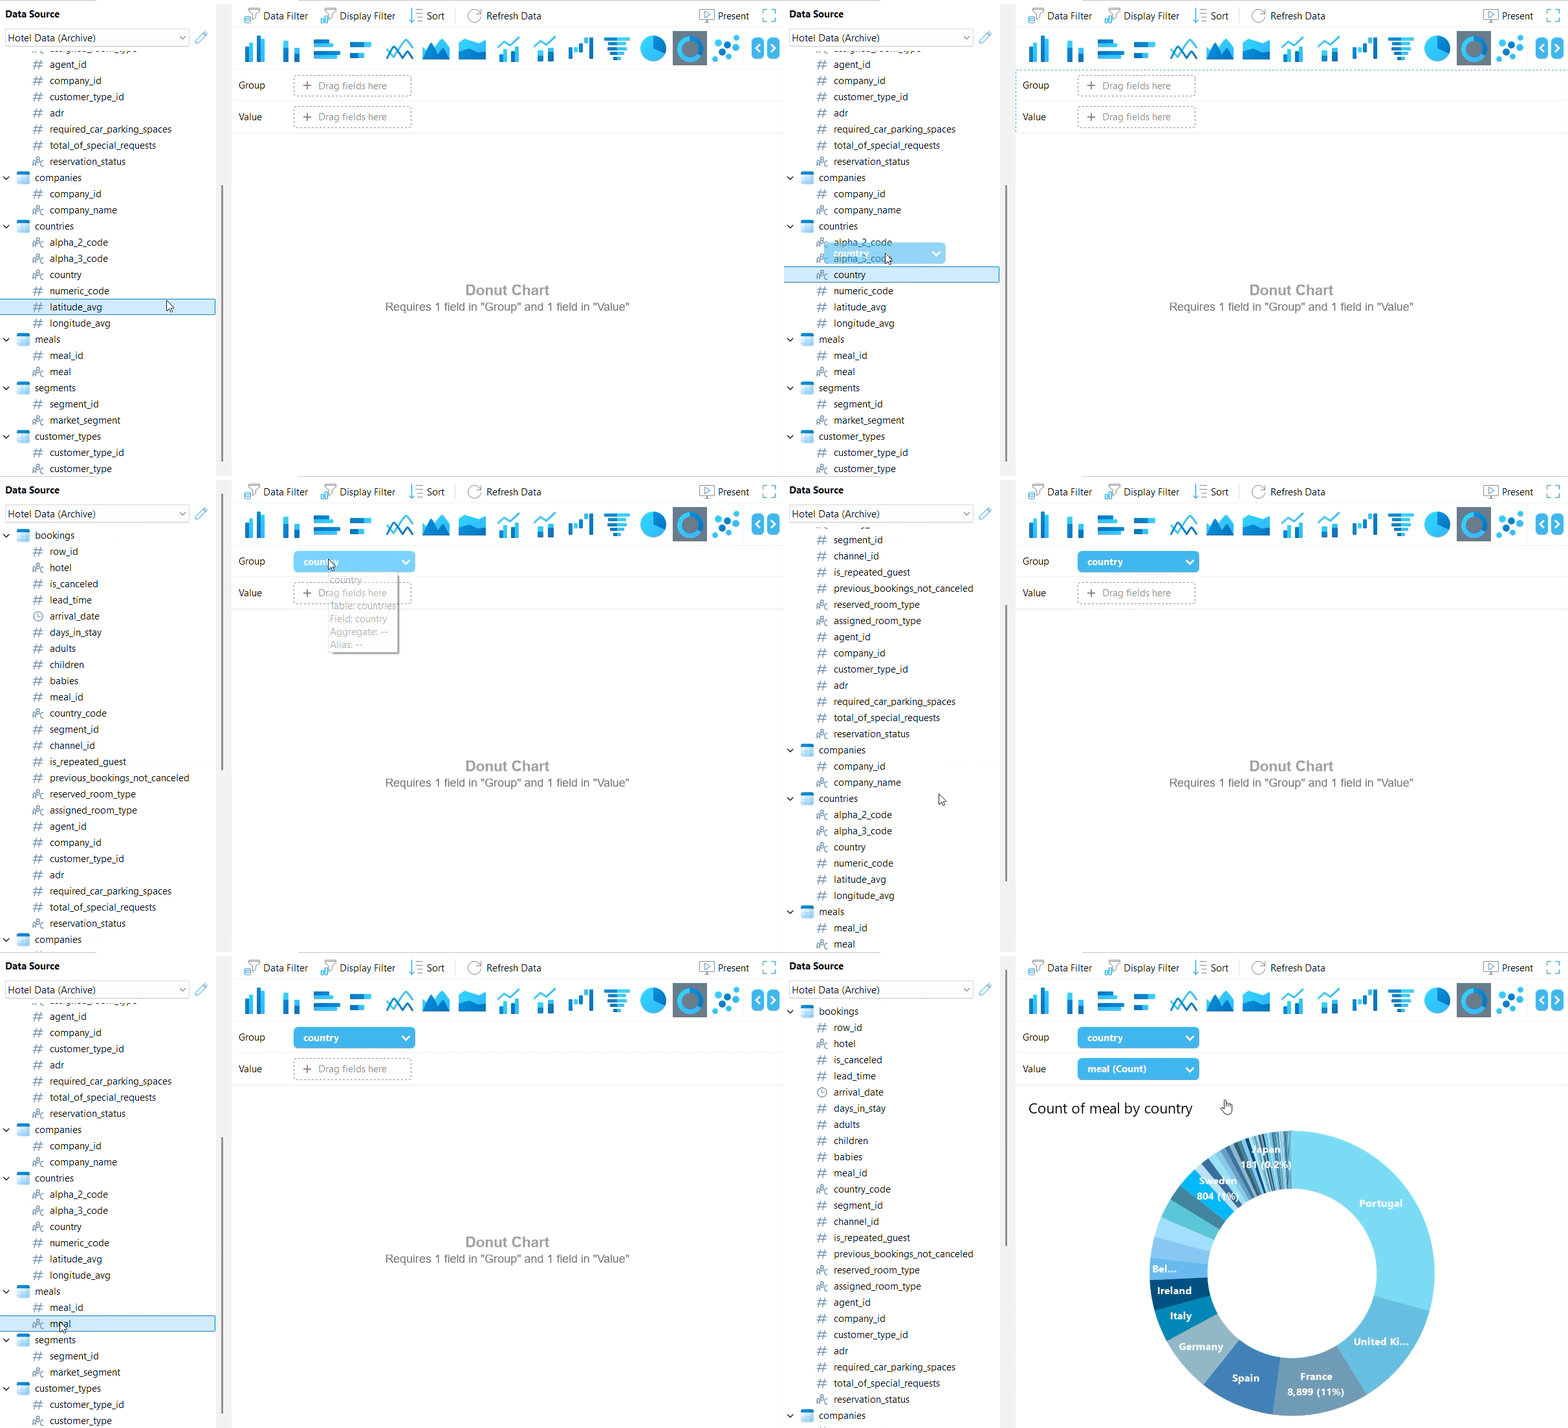
In-Chart Aggregations & Calculations
Apply math functions, compute running totals, or group dates into time intervals directly within your chart.
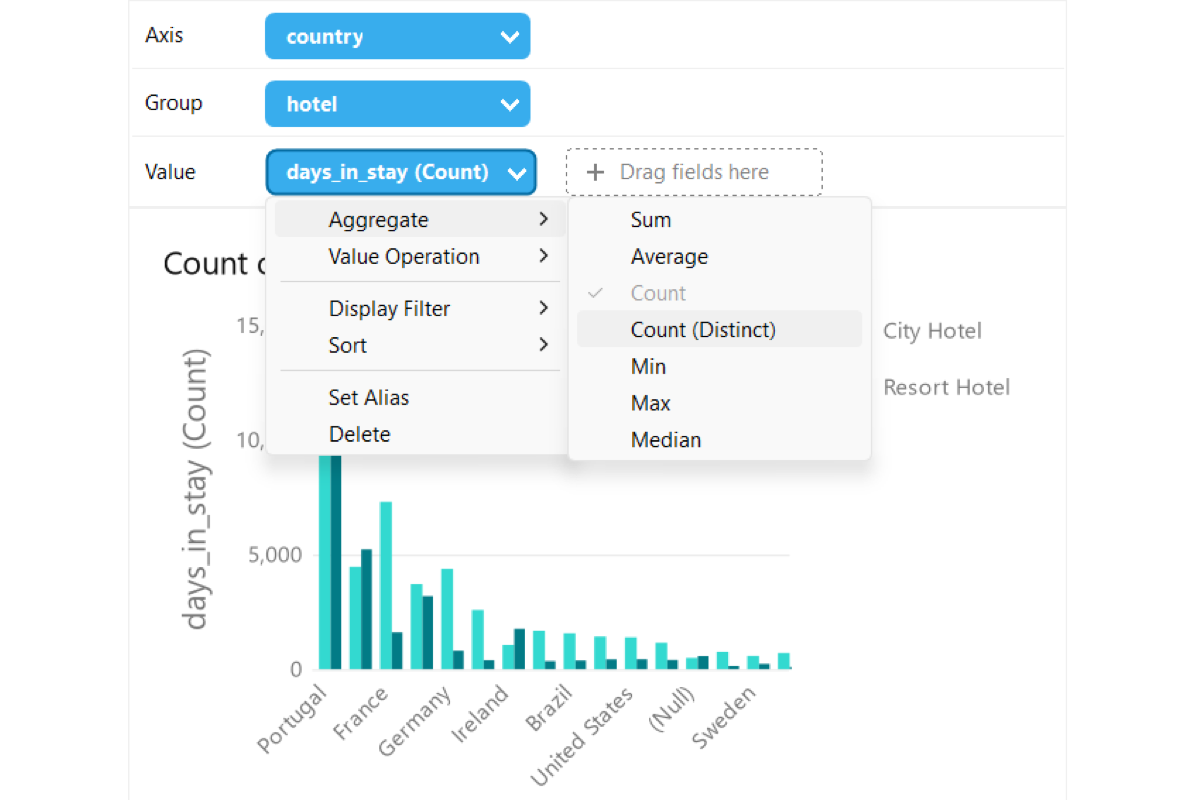
On-Canvas Filtering & Sorting
Filter, refine, and reorder data series instantly through intuitive context menus and field controls.
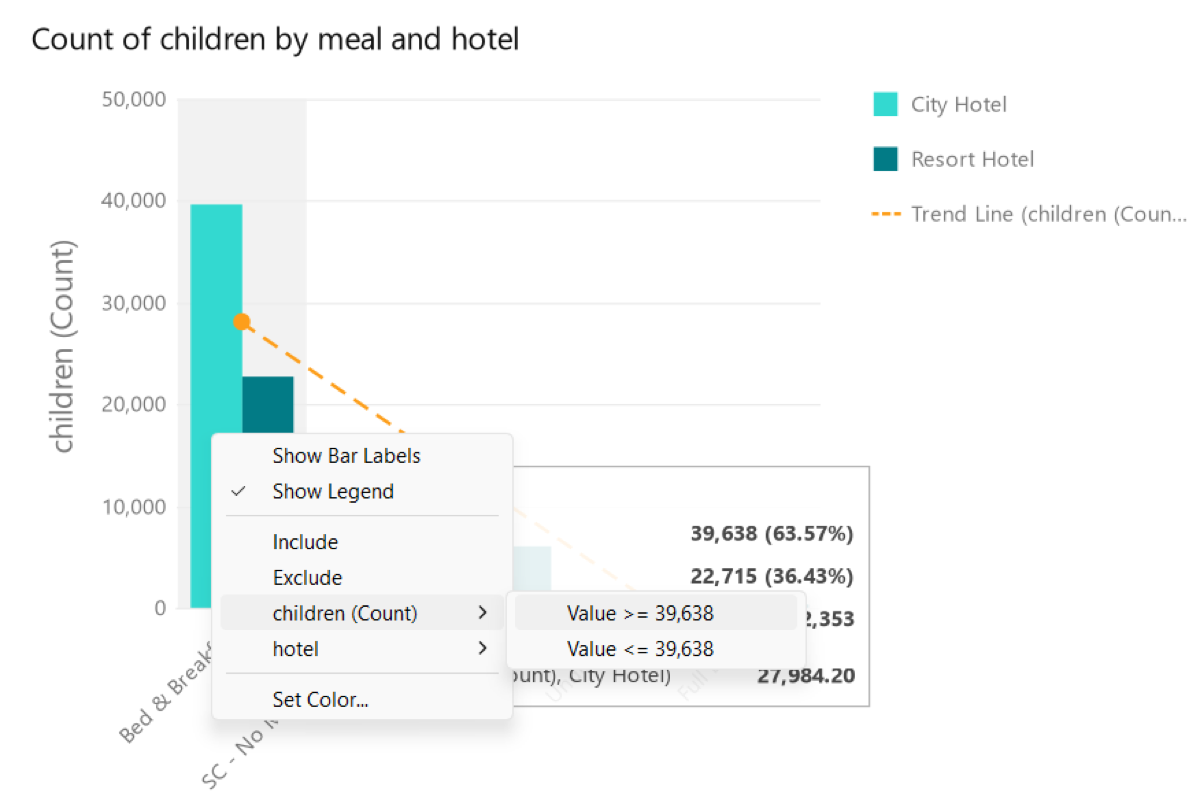
Visual Benchmarks
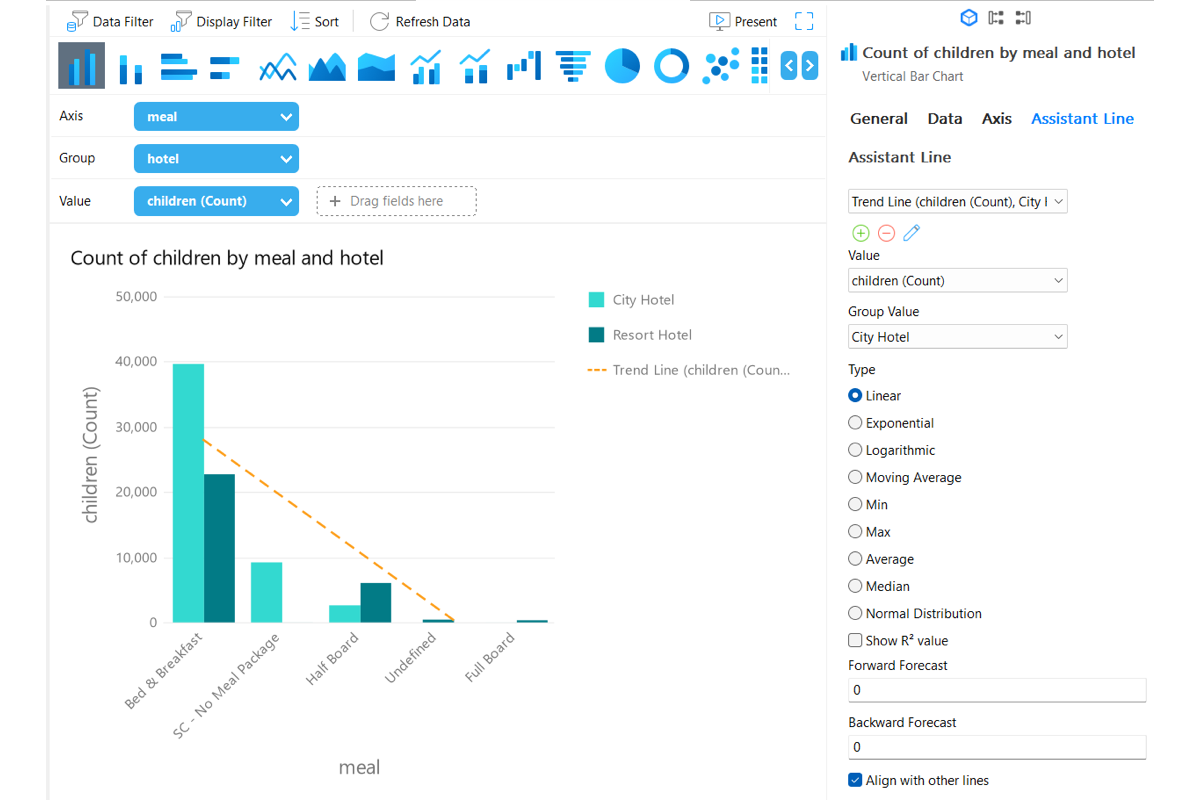
Add target thresholds, average lines, and trend lines so stakeholders instantly spot performance gaps.
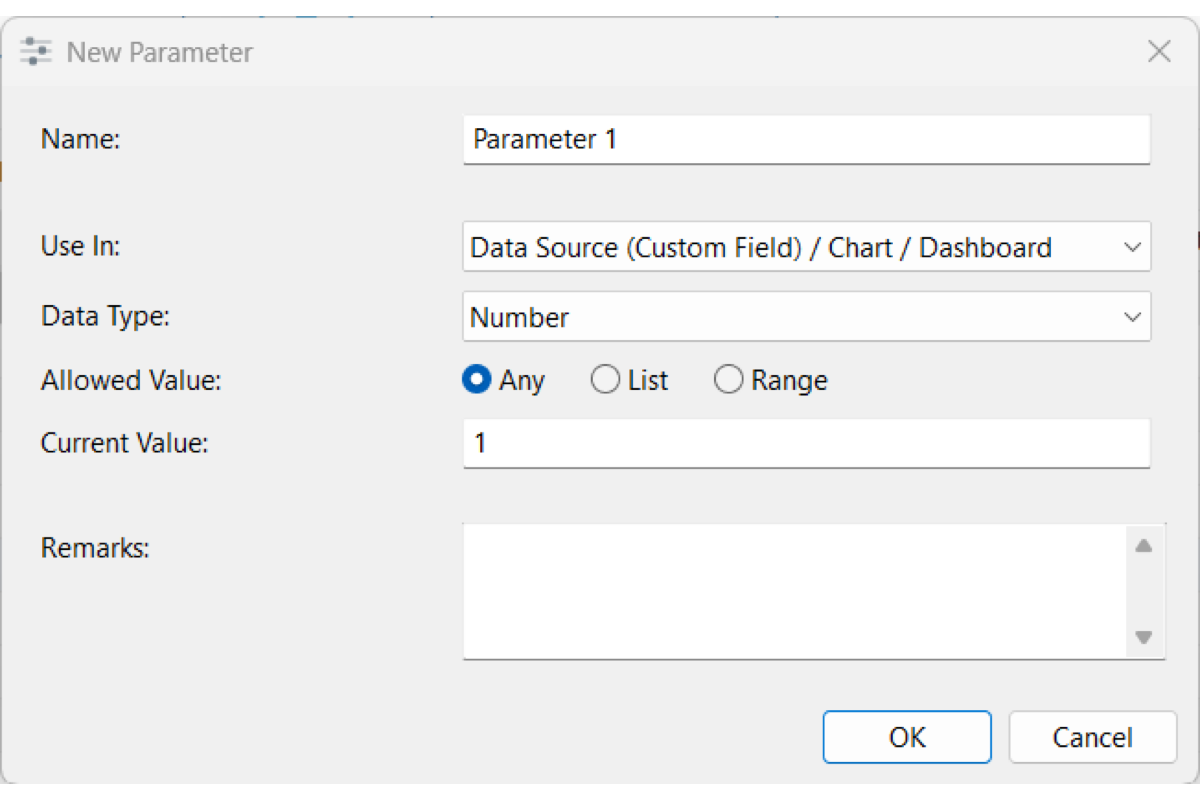
Global Workspace Parameters
Control your data displays dynamically across your entire BI workspace. Define global variables to filter queries, manipulate chart metrics, and drive reactive dashboard elements on demand, customizing all your visual insights with a single interactive slider or value control.
Build & Share Dashboards
Combine charts, filters, text, images, and shapes into interactive, multi-page storyboards that stay up to date automatically.
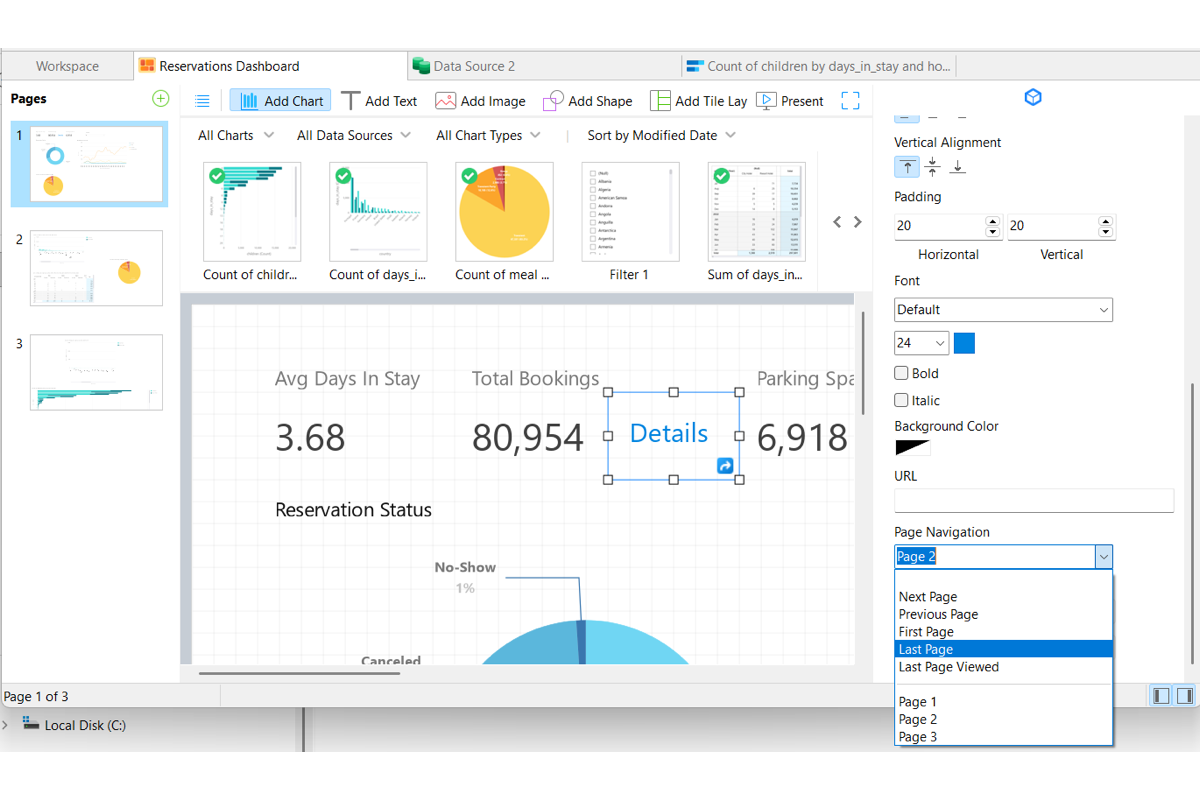
Multi-Page Storyboarding & Navigation
Organize reports across dedicated pages, linking charts, labels, or images for single-click jumps between views.
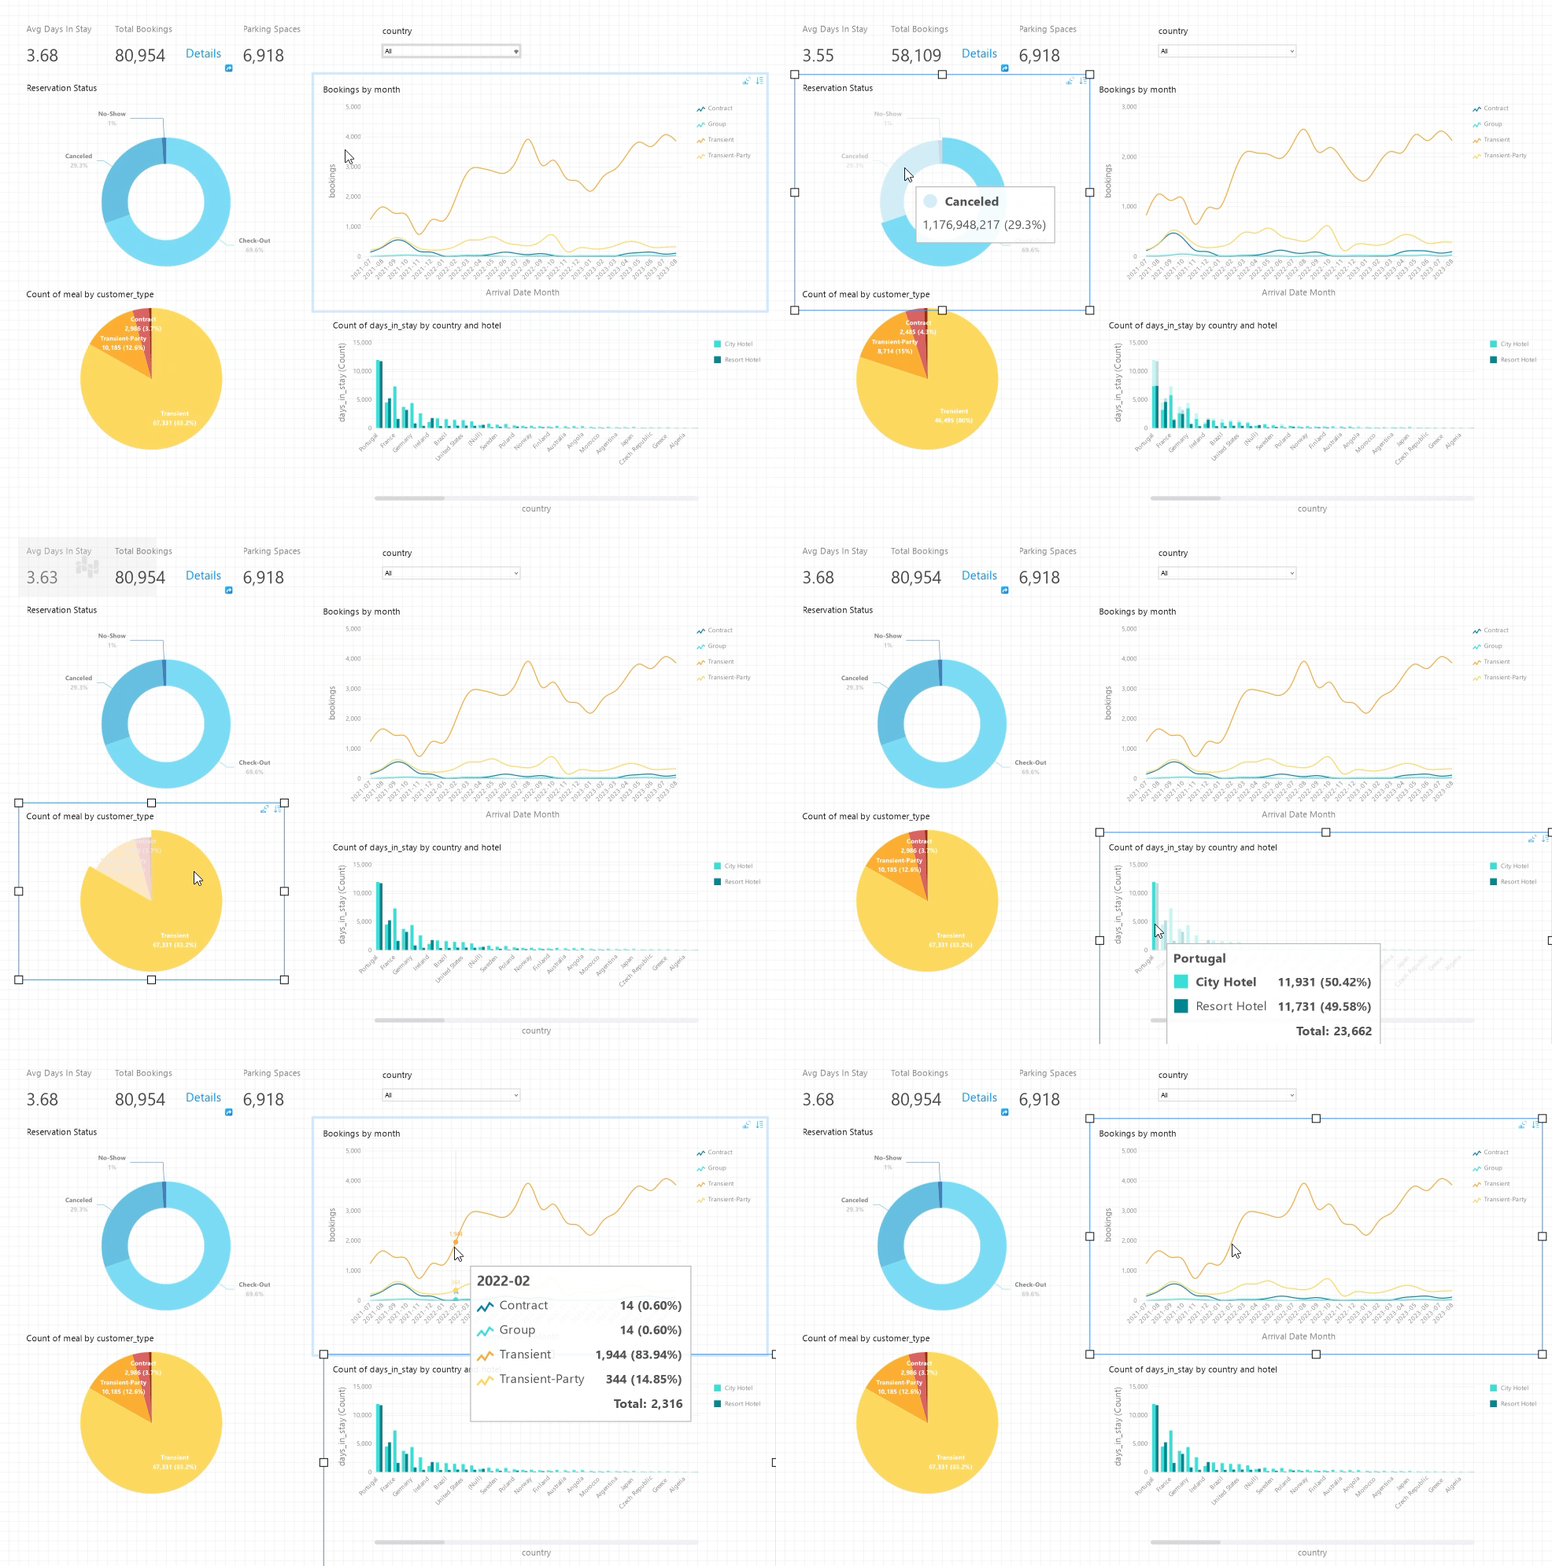
Interactive Cross-Filtering
Click any chart element to dynamically filter related visuals across the entire dashboard page in real time.
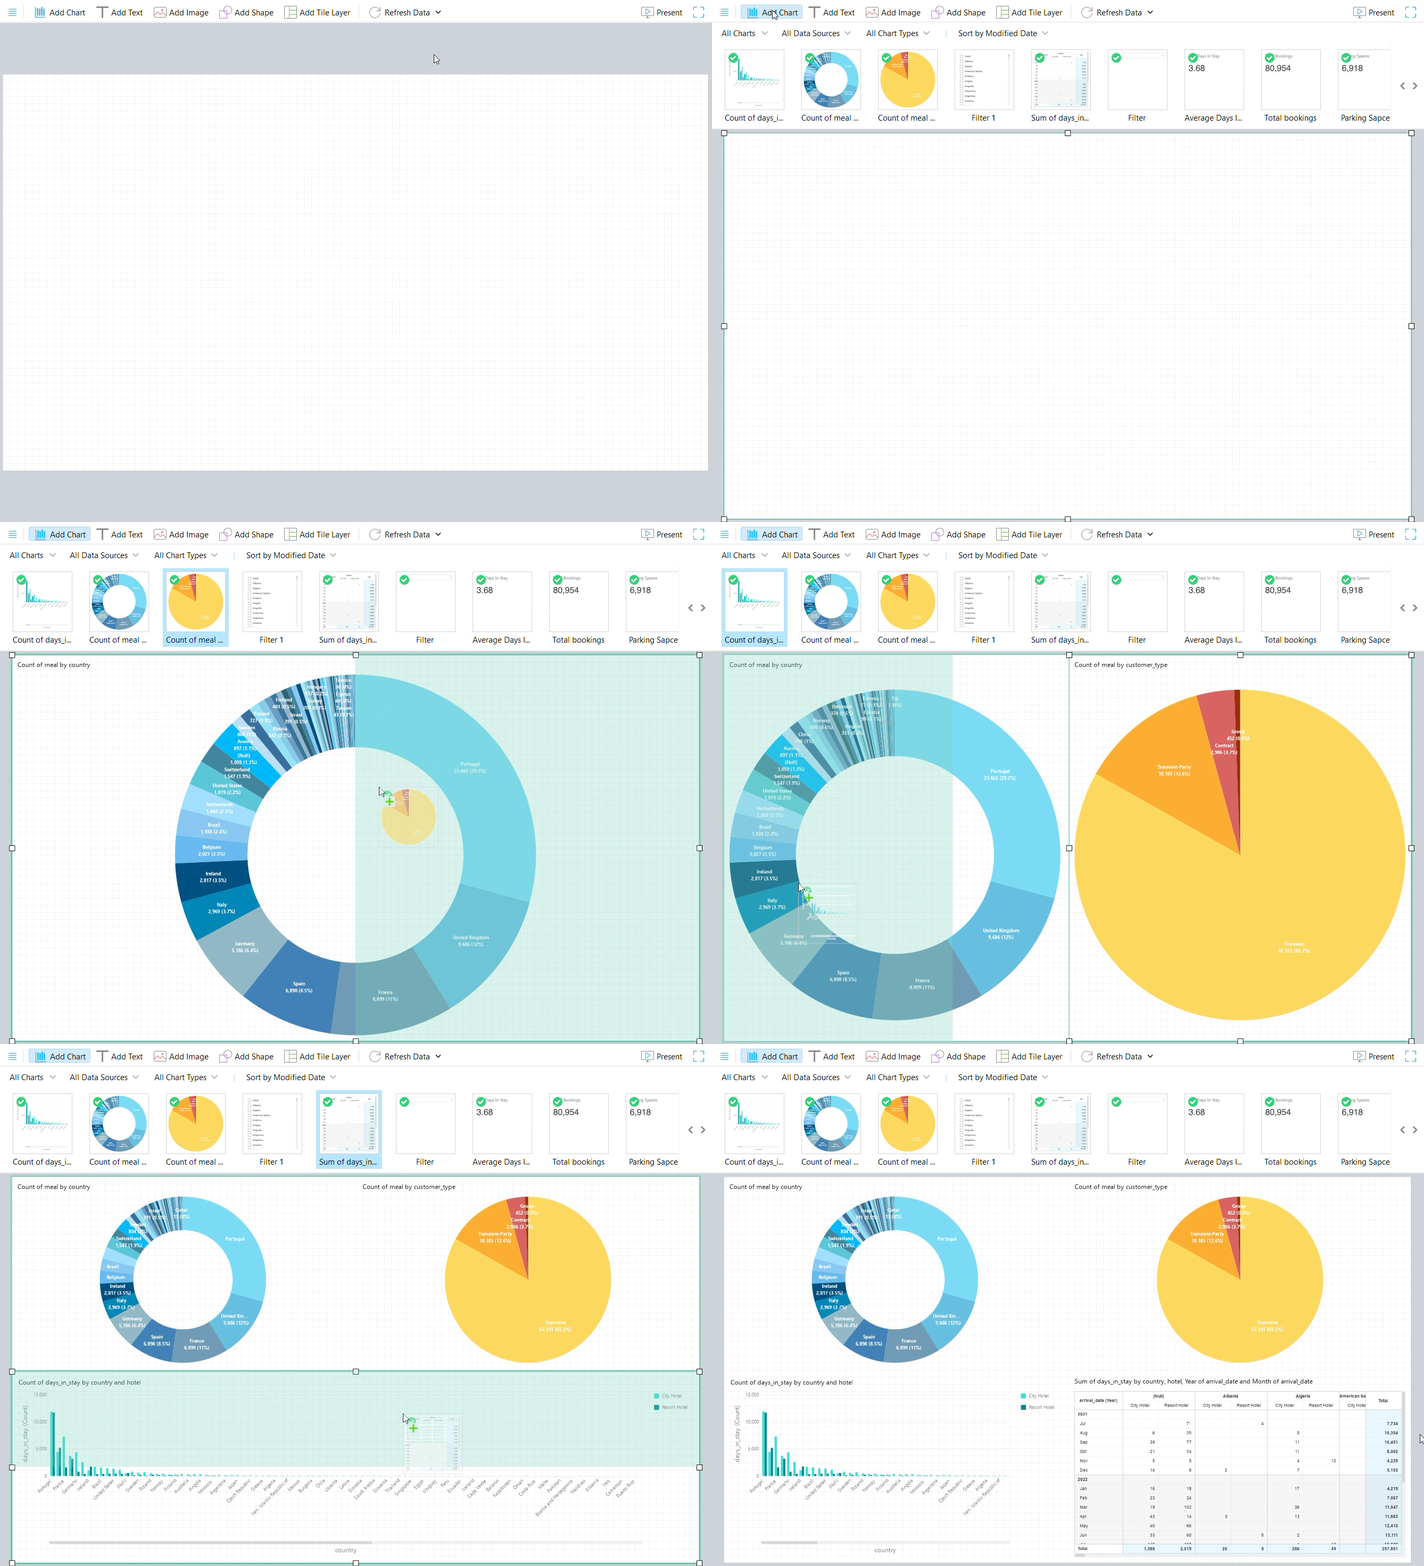
Smart Auto-Tile & Canvas Design
Snap components into structured grids automatically, or position elements precisely using drag-and-drop layering, alignment guides, images, and shapes.
Auto Refresh, Presentation & Export
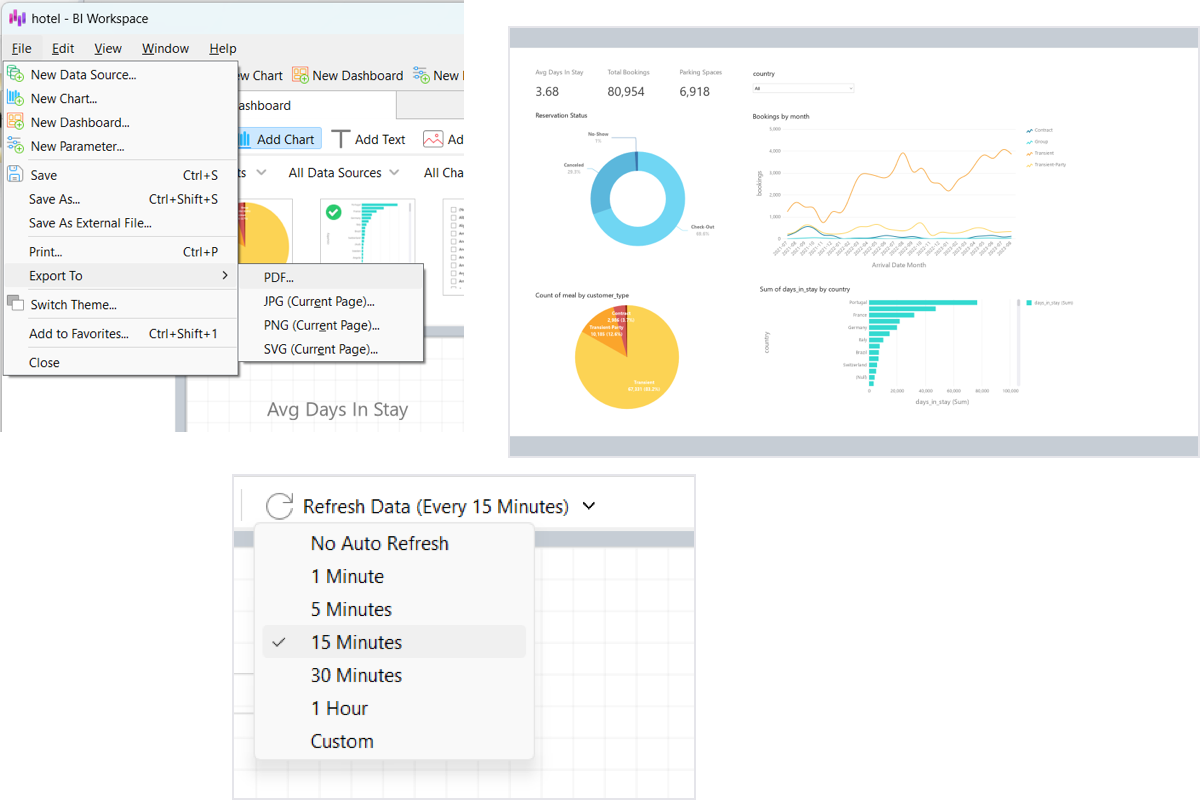
Set background intervals for live data updates, present full-screen interactive views with active parameter controls and one-click sorting, or export pages into print and digital formats.